Part I — Education · Ch. 4
Coordinate Networks and CPPNs: Audio-Conditioned Image Generation
Abstract
This chapter develops the neural image representation used by Inner Landscapes. A coordinate network receives an image location and current music features, then predicts an RGB color. We study how sound becomes numerical features, how those features select visual scale, and how a network learns from image colors. Chapter 5 turns the resulting color rule into a random-walk painting; Chapter 11 presents the artistic series.
Chapter Goals
-
Connect image coordinates and music features to RGB prediction.
-
Distinguish the 64-bin color features from the 96-bin zoom representation.
-
Understand layers, activations, Fourier encoding, loss, and training.
-
Follow the program from training examples to a saved checkpoint.
Introduction
A digital image usually stores a color at each pixel. A coordinate network represents the image with a learned rule: give it a location, and it predicts a color. Adding music features makes the current sound part of that prediction.
Compositional Pattern-Producing Networks (CPPNs) provide a broader context for constructing visual patterns from coordinate-based functions. The specific implementation studied here is XYSpecNet, which uses Tanh hidden activations and a Sigmoid RGB output. Its learned color rule is the foundation of the painter introduced in Chapter 5.
A useful starting point is NeuroMV, the neural music visualizer described by Kayo Yin and collaborators.1 Its use of image location and Mel spectrogram features for color prediction informs Inner Landscapes. The following sections develop the reference-image representation, music features, zoom targets, and training process used in Inner Landscapes.
Methodology
The Color-Learning Workflow
The neural stage follows this sequence:
reference image + music features and zoom targets coordinate network color loss checkpoint.
For a sampled music frame, the network predicts colors at every location on a training grid. The selected zoom target provides the corresponding target colors. Repeated comparison and weight updates teach the network a color rule, which is saved for use during rendering.
Music Representation and Zoom
From Sound to a Mel Spectrogram
Before the computer can use music, the sound must first be stored as numbers. A digital audio file does this by recording many measurements over time. Each measurement is called a sample. The sample rate tells us how many samples are stored in one second. In the main emotion audio files for this project, the sample rate is samples per second.
The samples describe the shape of the sound wave, but the project needs more than the wave shape. It also needs to know which frequencies are present. Frequency describes how quickly a vibration repeats. Low frequencies usually sound deeper. High frequencies usually sound higher. Music contains many frequencies at the same time, and these frequencies change as the music plays.
To see these changes, we do not analyze the entire song at once. Instead, we examine many short sections of the audio called windows. For each window, frequency analysis measures how strongly different frequencies are present. Then the window moves forward and the process repeats. This gives the computer a new description of the music many times per second.
Placing the results from all of these windows next to one another creates a spectrogram. The horizontal direction represents time, the vertical direction represents frequency, and the value at each location shows how strongly that frequency is present at that moment. In this way, a spectrogram lets us see both when something happens and which frequencies are present.
Our program uses a target rate of music frames per second. This matches the video frame rate used later. If the audio has a sample rate of samples per second, the distance between two neighboring music frames is
where is called the hop length. The floor brackets mean that the program keeps the whole-number part of the result because it must move by a whole number of samples.
For the main emotion audio files,
so
Neighboring music frames are therefore spaced samples apart. The program analyzes a window that is twice this length, or samples. Because the window is wider than the distance between neighboring frames, neighboring windows overlap.
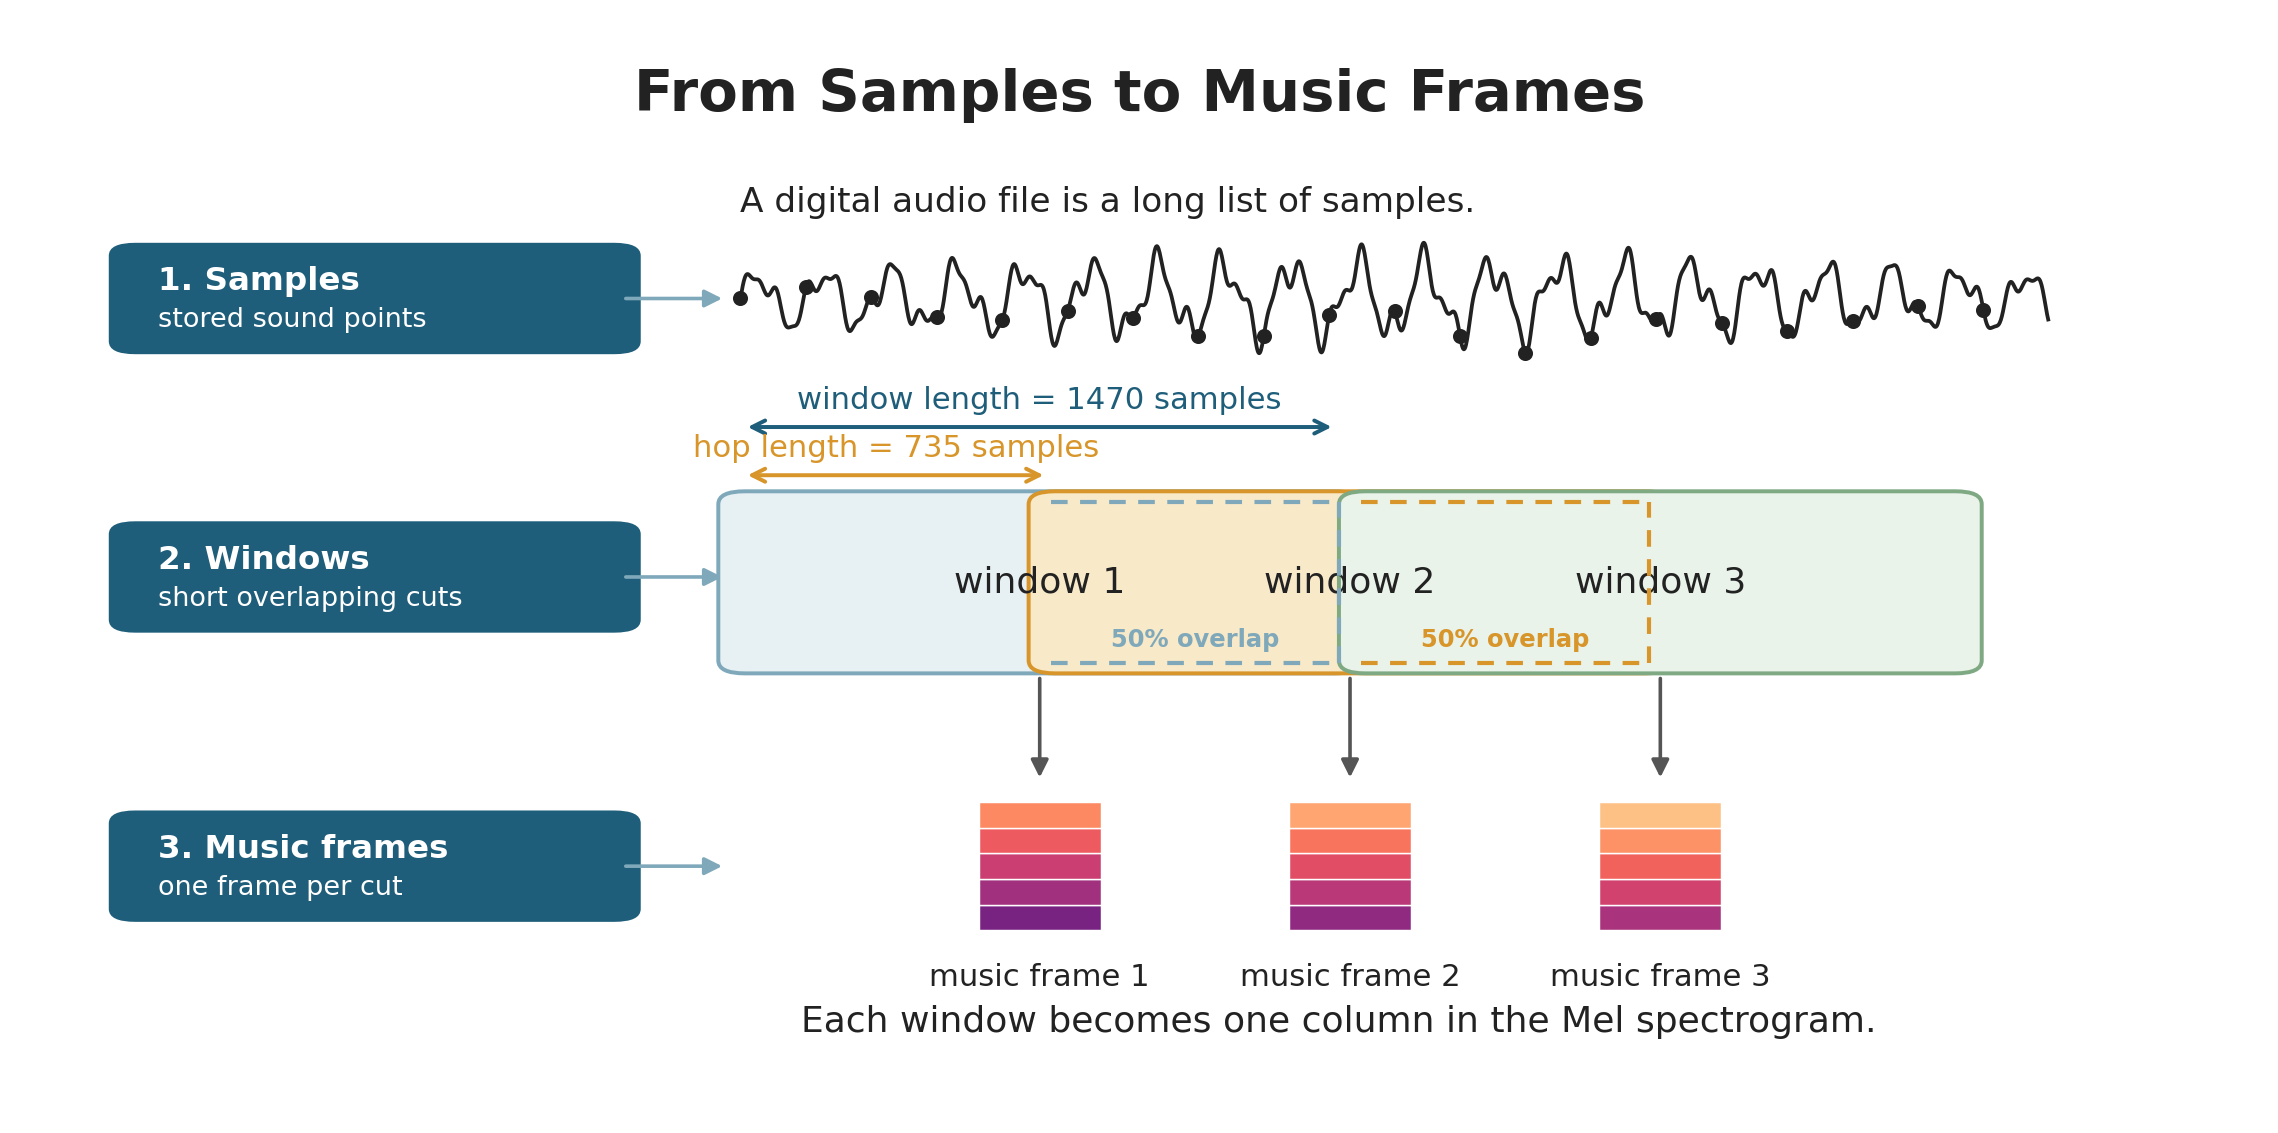
Figure 4.1 shows why the hop length matters. The program is not listening to one isolated instant. It is looking at a short window of sound, then sliding that window forward. This gives the system a steady stream of music frames that can be aligned with video frames.
A regular spectrogram organizes the result using frequency. Our system uses a Mel spectrogram. A Mel spectrogram groups frequencies into bands called Mel bins. These bands are arranged on a scale that roughly follows how people perceive differences between lower and higher sounds. The result is still organized by time and frequency, but each time frame is now represented by a list of Mel values.
The project uses two Mel spectrogram settings. For the neural network, each music frame has Mel values. This means one frame of music becomes a vector with shape . Across the whole audio file, the spectrogram has shape , where is the number of music frames. For zoom decisions, the program also computes a second Mel spectrogram with Mel bins. That second representation is used later to decide which zoom target should be selected.
Useful Rule: The -bin Mel spectrogram provides music features for predicted color. The -bin Mel spectrogram helps choose visual scale. They both come from the same sound, but they serve different jobs in the system.
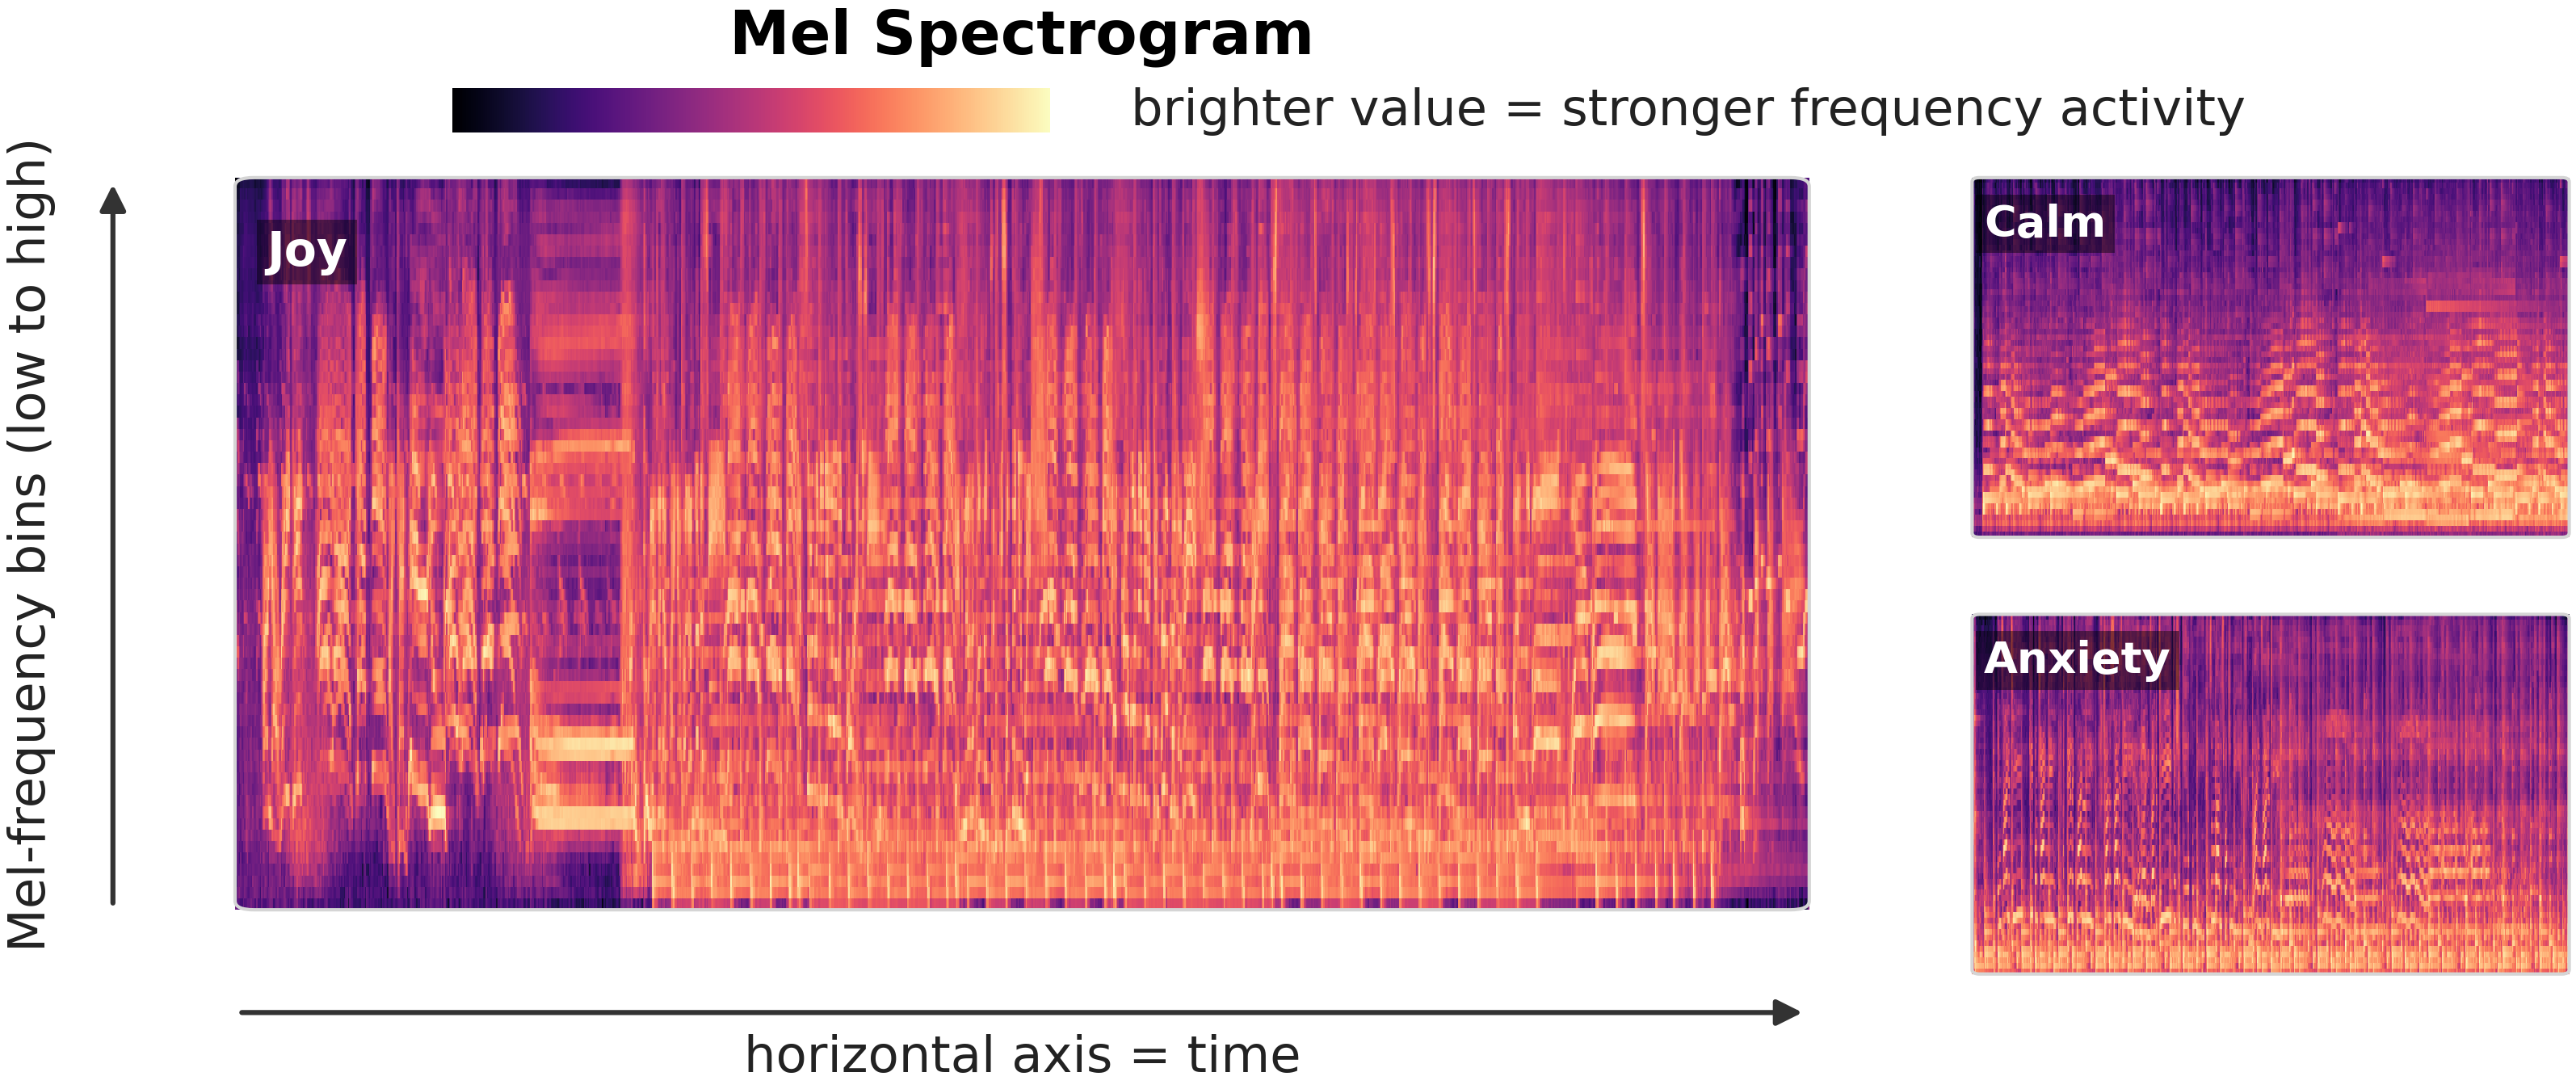
Figure 4.2 shows Mel spectrograms from three pieces in Inner Landscapes. The horizontal axis represents time, while the vertical axis represents Mel frequency bins. Brighter regions show stronger activity in those frequency bands. The different patterns in the Joy, Calm, and Anxiety examples show how different pieces of music produce different distributions of frequency activity over time.
Now that we know how sound becomes a Mel spectrogram, we can look at the first job of that representation: providing music features to the neural network.
Music Features for the Neural Network
The Mel spectrogram gives us a new description of the music at many moments in time. The next question is how the neural network can use one of those moments. A single music frame tells the computer what the music is doing now. It does not tell the computer where in the image a color should be predicted. For that reason, the music features must be paired with an image location.
Let represent the -bin Mel vector at time frame . After the log transform and normalization, each entry of this vector is scaled to the range from to . This vector is the current music features. It gives a compact numerical summary of the sound at that moment.
The neural network does not receive alone. It receives together with a location from the image grid. The model’s question is local: given an image location and the current music features, what RGB color should appear here?
During training, the image is represented on a grid, so one full grid contains image locations. For one selected music frame, the same music values are repeated for every location on this grid. Each row of the model input contains two coordinate values and music values:
Therefore, one training input for one music frame has shape . The columns come from coordinate values plus music values.
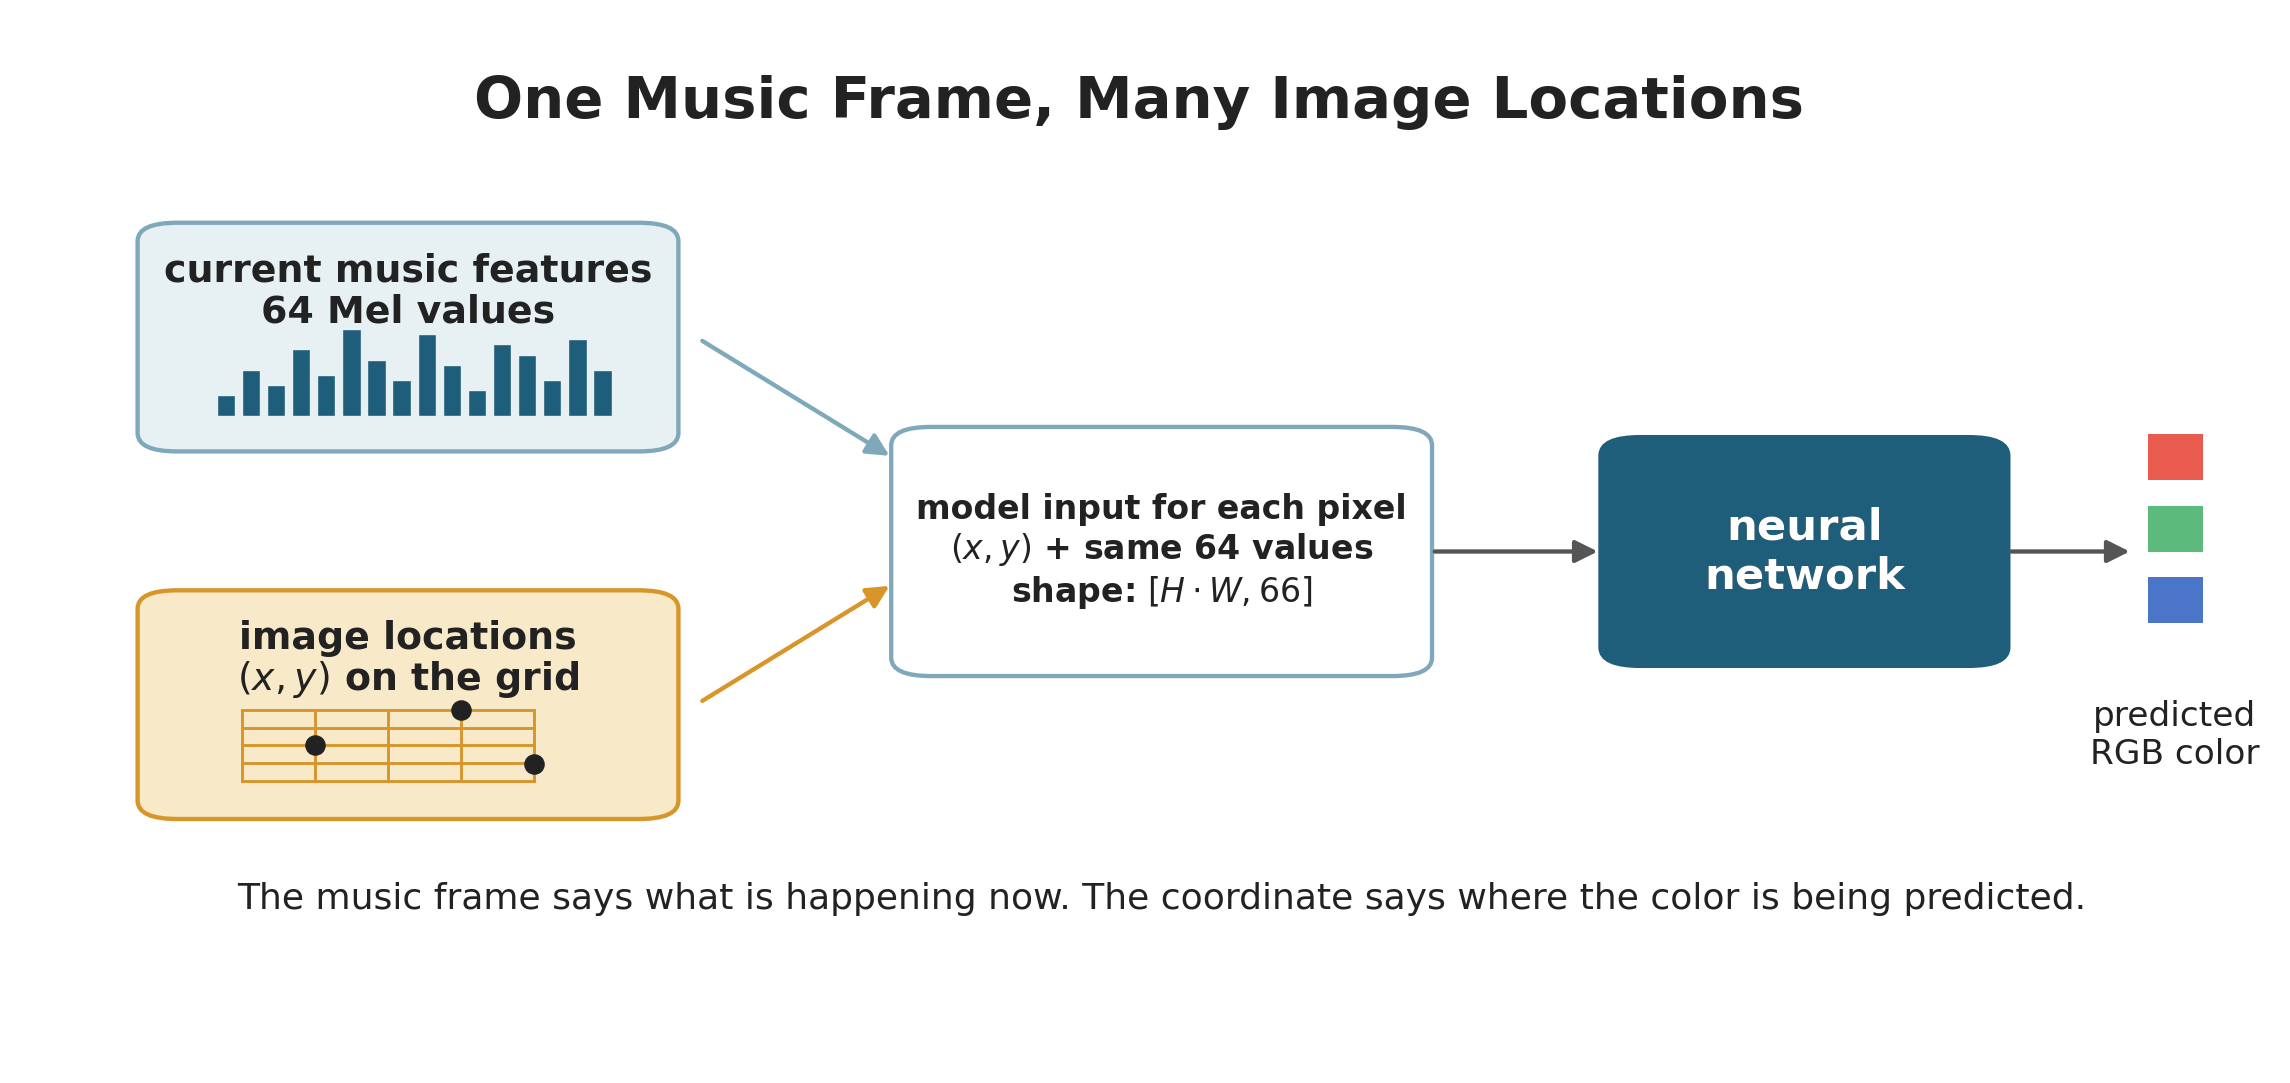
Figure 4.3 shows the main idea. The music frame describes the current sound. The image location tells the network where it is being asked to predict a color. The output is not a whole image all at once in the usual sense. It is a color rule applied many times, once for each location.
Key Distinction: The music features describe time. The image location describes space. The neural network needs both: without music, the color would not respond to the song; without location, the model would not know where in the image the color belongs.
The target color for each location comes from a version of the reference image. Which version is used depends on the selected zoom target. That is the second job of the music representation.
Music-Driven Zoom
Music does more than provide color features. It also helps decide the visual scale of the target image. A calm or quiet moment may use a wider view of the reference image. A stronger moment may use a closer view. This gives the system a way to connect musical change with visual zoom.
The program uses a second Mel spectrogram for this purpose. The color model uses Mel bins, but the zoom decision uses Mel bins. For each time frame, the program looks at the th percentile of the normalized log-Mel values:
where is the -bin Mel vector at time frame after log scaling and normalization. The value is not the loudness of the whole song. It is a high-energy summary of one music frame. It asks: how strong are the stronger frequency bands right now?
The raw signal can jump too quickly from frame to frame, so the program smooths it with a moving average. It then normalizes the smoothed signal again and compares it with two emotion-specific threshold values. These thresholds divide the signal into three zoom levels:
Here is the lower threshold and is the higher threshold. In the source code, these levels are stored as , , and , but in the explanation we call them level , level , and level because that is easier to read.
The threshold values are not the same for every emotion. The program chooses them from percentiles of that emotion’s own signal. This matters because a quiet piece and an intense piece can have very different numerical ranges. Percentile thresholds let each piece use the three zoom levels in a way that fits its own music.
The program also uses two stabilizing ideas. First, a zoom level must last for a minimum amount of time before it can change again. Second, a small hysteresis margin prevents the level from flickering when the signal sits close to a threshold. Hysteresis means that the signal must move a little past the threshold before the level changes back. These choices make the visual scale change more smoothly.
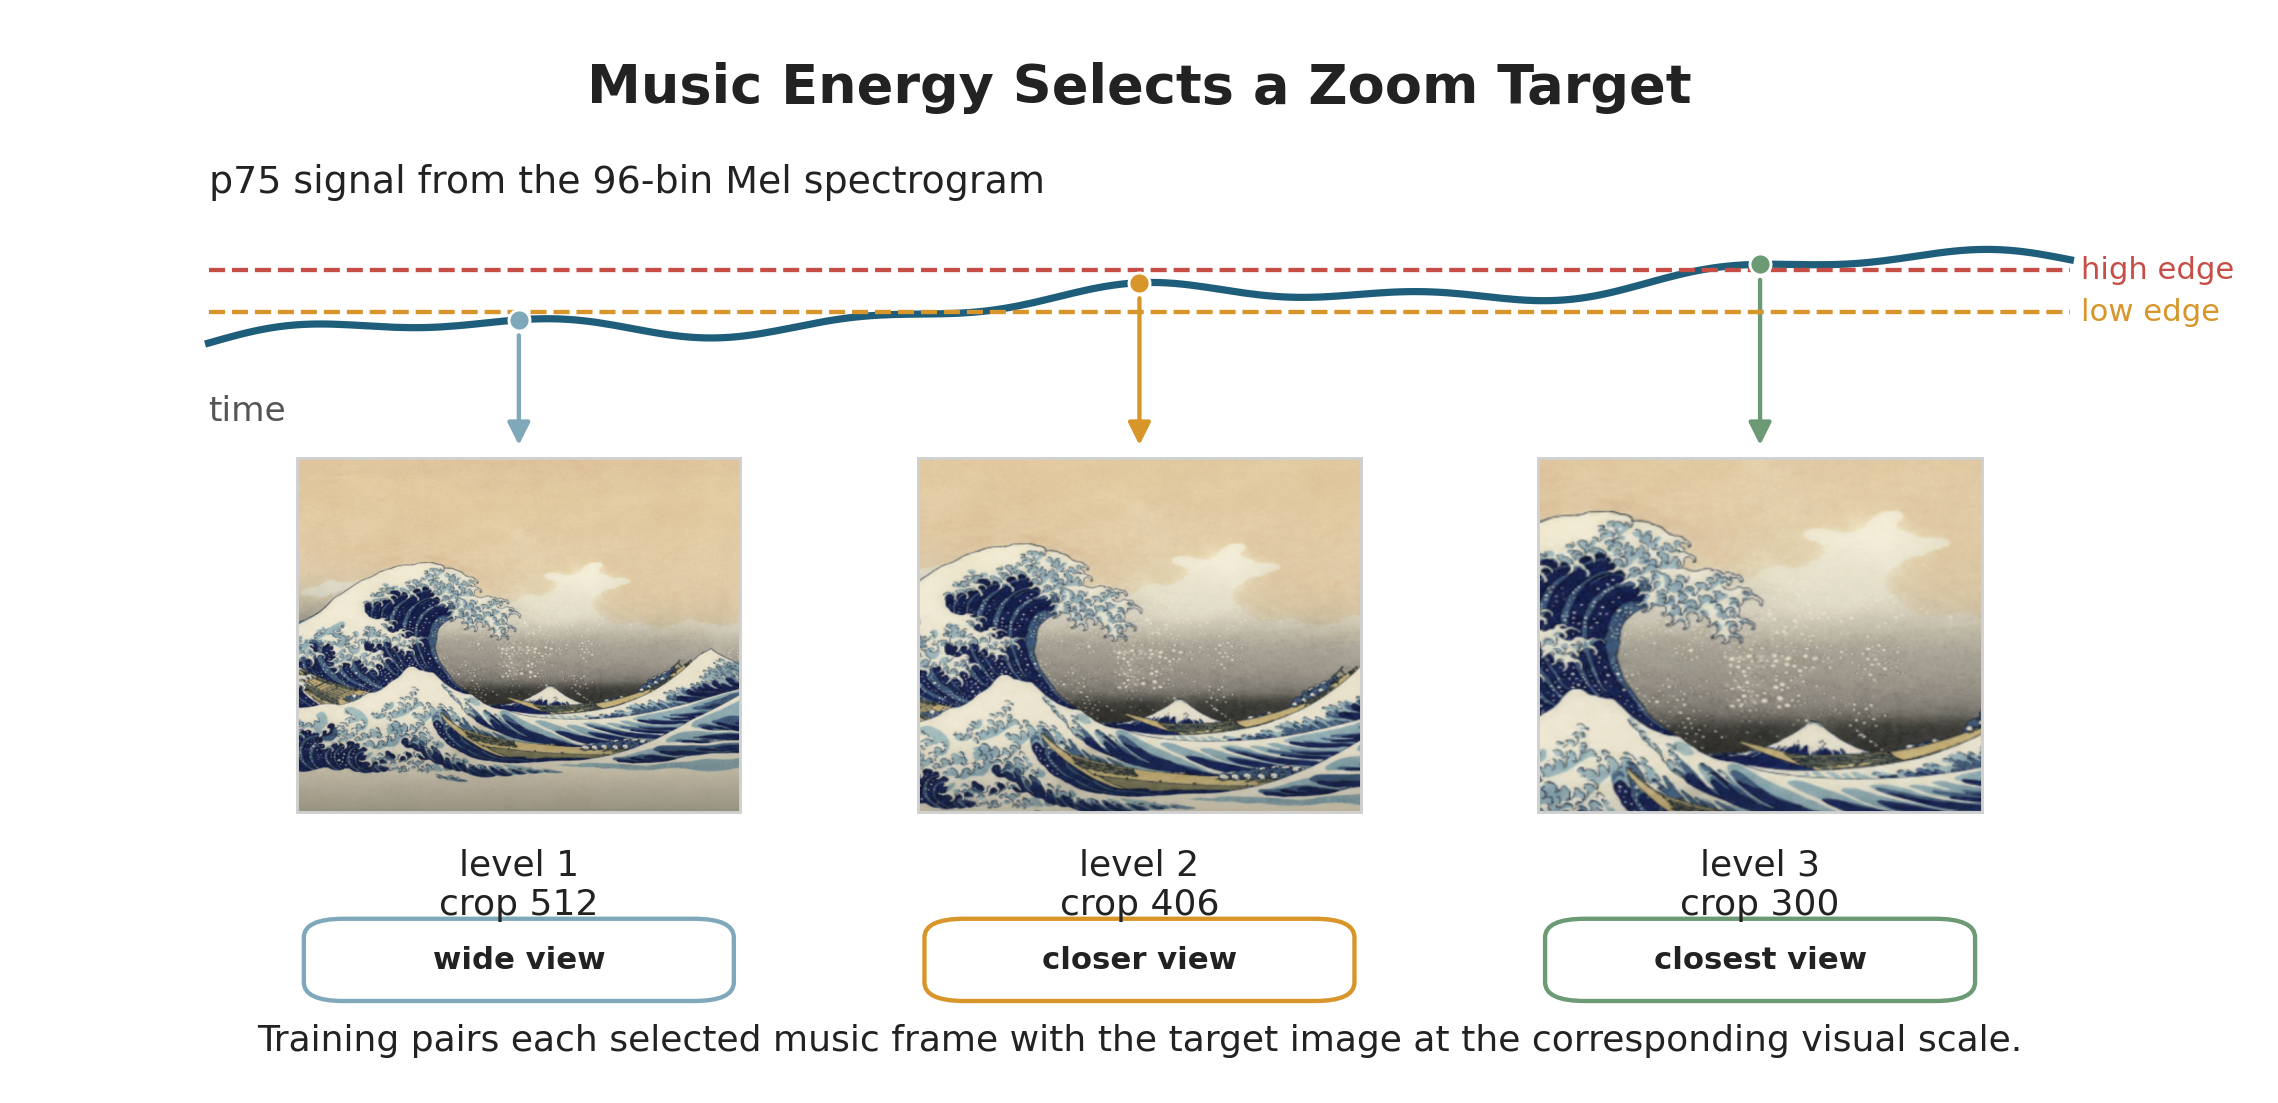
Figure 4.4 shows the result for the Joy reference image. Level uses the widest view. Level crops the image more tightly and resizes it back to the training size. Level uses the smallest crop, so it looks closest. The neural network then learns colors from the zoom target selected for the sampled music frame.
The crop sizes are not the same for every emotion. Each piece has its own visual scale settings:
| Emotion | Zoom crop sizes |
|---|---|
| calm | |
| nostalgia | |
| grief | |
| joy | |
| anxiety |
Useful Rule: A smaller crop size means a stronger zoom. The image is cropped around the center and then resized back to the training grid, so the neural network always predicts colors on the same coordinate system.
The training program samples music frames from the available zoom levels, so the model sees examples from each visual scale. This prepares the neural network to connect current music features, image location, and selected zoom target. The next section explains what kind of neural network can learn that connection.
Neural Image Representation
The reference image begins as pixels, but the trained system does not simply copy those pixels into the final video. Instead, it learns a coordinate-based image rule. The rule takes an image location and current music features as input, then returns a predicted RGB color.
What the Neural Network Learns
A neural network is a function with many adjustable numbers inside it. These adjustable numbers are called weights and biases. At the start of training, they do not yet describe the reference image well. Training changes them until the network gives better color predictions.
In this project, the network is not asked to classify an image or name an emotion. Its job is more direct. For a location and current music features , it predicts an RGB color:
The symbol means “the color predicted by the network.” The hat reminds us that this color is a prediction. The symbol stands for all the learned weights and biases inside the network. The output has three numbers because an RGB color has a red value, a green value, and a blue value. The final layer uses a sigmoid function, so these three numbers stay between and .
This is useful because a rule can be queried at any location. During training, the locations come from the grid. During rendering, the random walkers visit locations on a larger canvas, and those locations are normalized before being sent to the same learned rule.
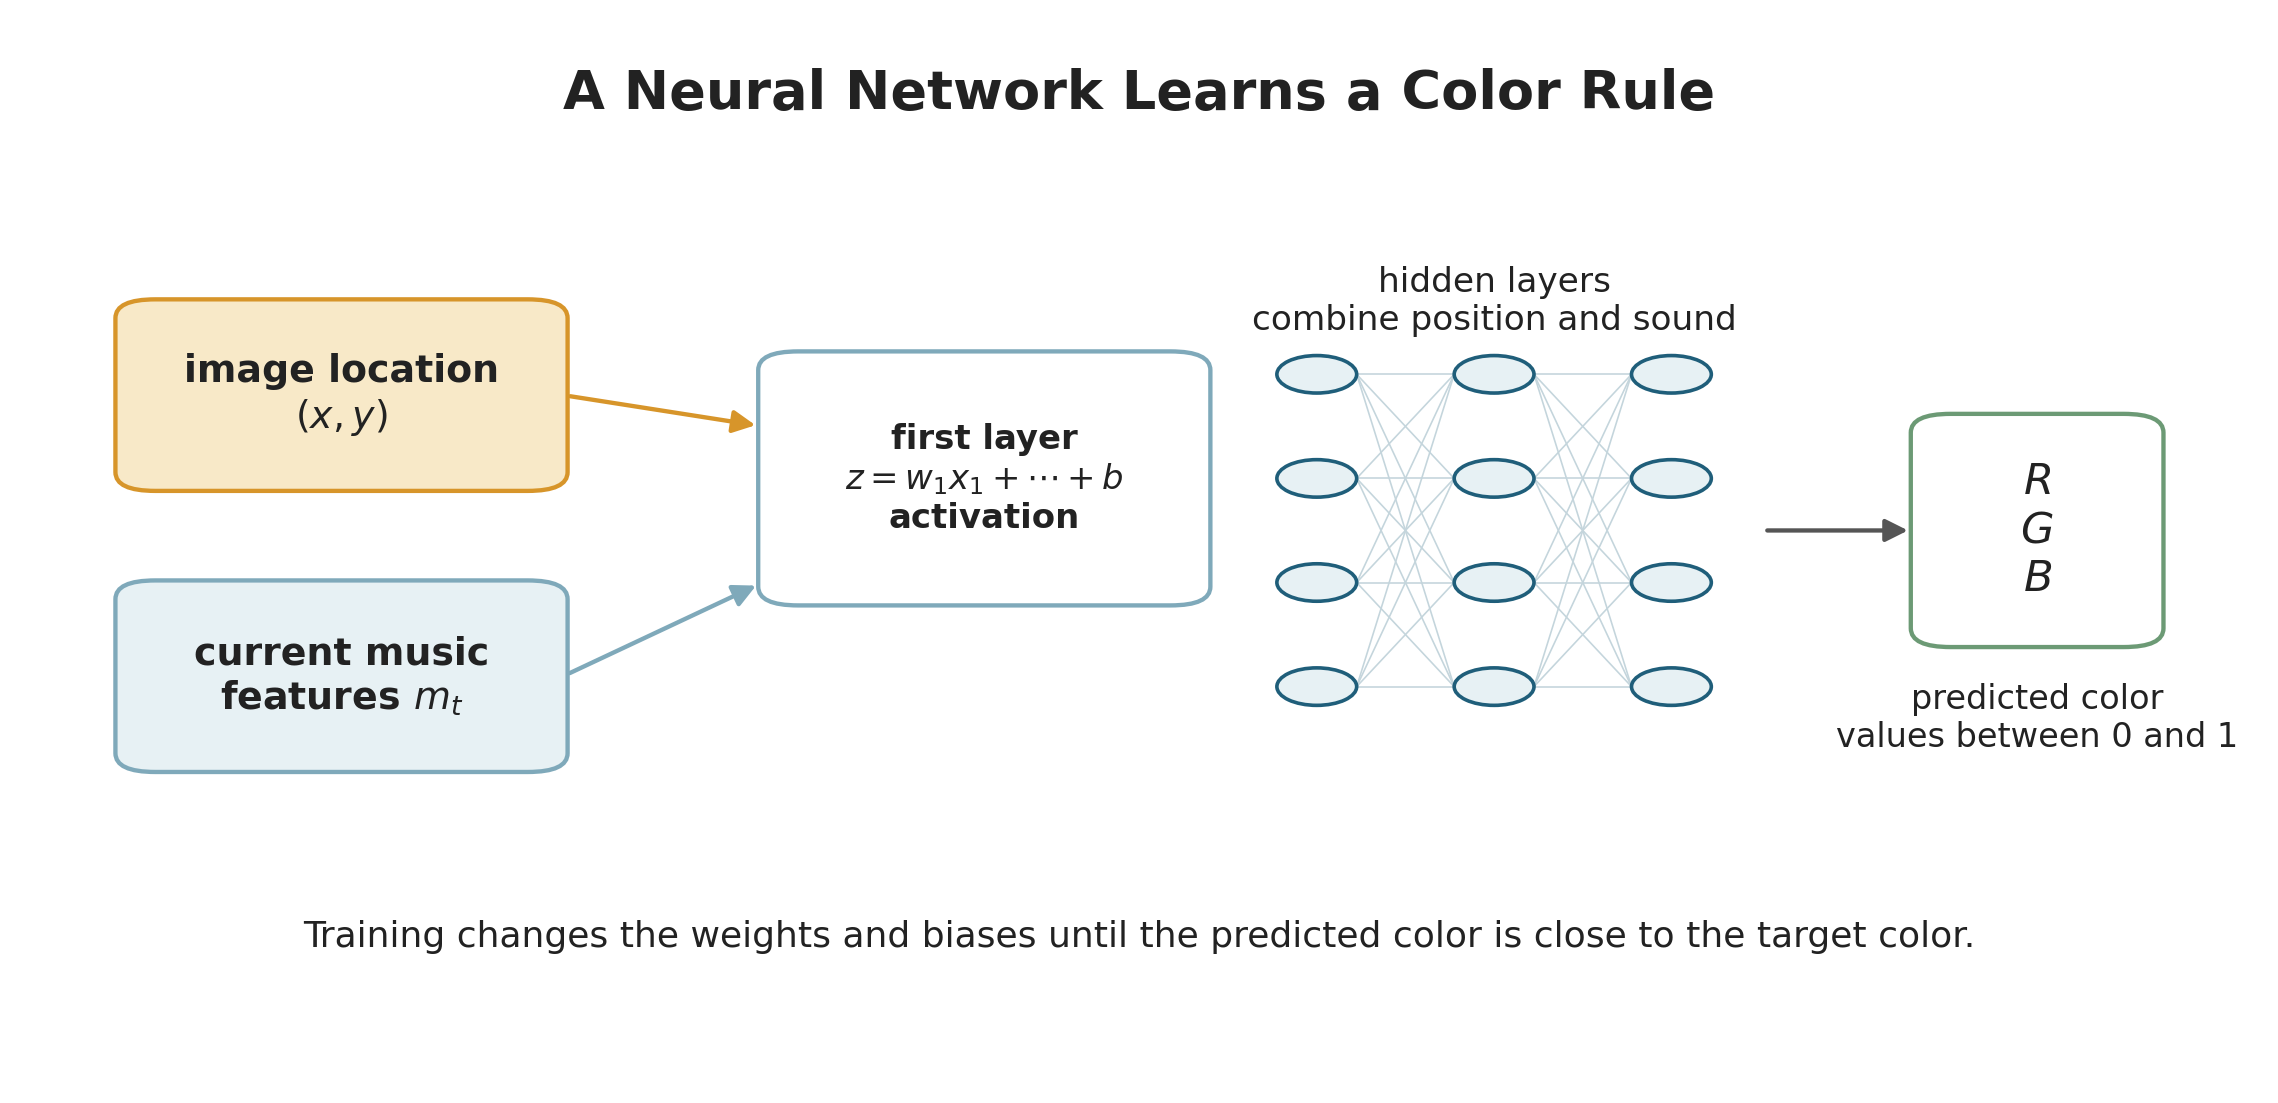
Figure 4.5 shows the network as a chain of transformations. The input gives the network a question. The hidden layers transform that question into intermediate values. The output gives the predicted color.
Neurons, Layers, and Activations
The basic unit of a neural network is a neuron. A neuron takes several input numbers, multiplies each one by a weight, adds a bias, and produces a new number. In a simple case, this looks like
Here are input values, are weights, and is the bias. If a weight is large, that input has a stronger effect on the neuron. If a weight is close to zero, that input has little effect.
After computing , the network applies an activation function. An activation function bends the number before sending it to the next layer. The hidden layers in this project use the hyperbolic tangent function, written as . Without activation functions, stacking many layers would still behave like one large linear calculation. With activation functions, the network can learn curved and detailed relationships, such as how color changes across waves, clouds, sky, or water.
A layer is a group of neurons working side by side. This project uses several hidden layers, each with neurons. The first layer receives the encoded image location and the music features. Later layers combine these values into more useful internal patterns. The final layer produces the three RGB numbers.
Concept in Focus: A neural network is not magic memory. It is a large adjustable formula. Training changes the weights and biases so that the formula maps image location and current music features to a useful predicted color.
The Forward Pass
The calculation that goes from input to output is called the forward pass. First, the program builds one input vector from the encoded location and the current music features. Then each layer transforms the vector it receives:
and the same pattern continues through the hidden layers. Here and are matrices of weights, and and are bias vectors. A matrix is just a rectangular table of numbers. Multiplying by the matrix lets one layer combine many input values at once.
After the hidden layers, the final layer produces three output values:
The symbol is the sigmoid function. It squeezes each output value into the range from to , which matches the normalized RGB color range used during training. This is why the network can be trained with image colors as targets.
Fourier Features for Image Location
The first part of the input is the location . The program normalizes each coordinate so that the image ranges from to in both directions. A normalized coordinate system makes the model less dependent on the raw pixel size of the canvas. The left side of the image is near , the right side is near , and the top and bottom are represented in the same way along the direction.
The coordinate is then expanded with sine and cosine features. This is called a Fourier-style coordinate encoding. The purpose is to give the network several ways to sense position: broad, slow changes and smaller, faster changes. The standard implementation uses the frequencies
The Nostalgia model uses one additional frequency, , but the idea is the same. The extra frequency gives that model one more fine-scale coordinate pattern.
These encoded coordinates help the network represent image detail more easily than raw alone. Raw coordinates change smoothly from left to right and top to bottom. That smoothness is useful, but it can make fine visual structure harder to learn. Sine and cosine features add repeating patterns at several scales, giving the network more ways to describe edges, waves, and small changes in the image.
For each frequency, the program adds sine and cosine versions of both coordinates. In the standard setting, the two raw coordinate values therefore become
coordinate features. With the extra Nostalgia frequency, the coordinate part becomes features. In both cases, these coordinate features are then combined with the music features inside the network.
L1 and L2 Color Loss
Training needs a way to tell whether the predicted color is good. For a sampled music frame , the program already knows the selected zoom target. At each location, the model predicts a color, and the program compares that prediction with the color from the selected zoom target:
The loss is one number that summarizes how wrong the prediction is. The program combines two common kinds of color error: L1 loss and L2 loss.
L1 loss measures absolute difference:
This means it looks directly at the size of the color mistake. If the prediction is off by , the L1 error is . If it is off by , the L1 error is . L1 loss is useful because it is not dominated too strongly by a few very large mistakes. In image problems, this can help preserve sharper structure.
L2 loss measures squared difference:
Squaring makes larger mistakes count more. An error of becomes , while an error of becomes . This encourages the model to reduce large color errors and often gives smoother training behavior.
Inner Landscapes uses both:
The two terms have equal weight. The L1 part keeps the model from caring only about large errors, while the L2 part still pushes the network to correct large mistakes. Together, they give a balanced color-learning signal.
Edge-Weighted Training
The program also gives different image locations different weights. The weight map is built from edge strength in the reference image, with a base weight so that non-edge pixels still matter. This helps the model pay more attention to visually important structure without completely ignoring smoother regions.
This matters because not every pixel has the same visual importance. A small color error along the outline of a wave may be more noticeable than the same size error in a smooth region of sky. Edge-weighted training tells the model, in effect, to spend extra attention on locations where the reference image has stronger structure.
If is the image weight at one location, the local training loss can be understood as
The full loss is the average of this weighted error over sampled locations, color channels, and training examples.
Backpropagation and the Checkpoint
Once the loss is computed, the network must know how to change its weights. This is where derivatives enter. A derivative tells us how much one number changes when another number changes. If a small increase in one weight makes the loss larger, training should push that weight downward. If a small increase makes the loss smaller, training may push that weight upward.
Backpropagation is the method that computes these directions for all the weights. It starts from the output error and moves backward through the network. For a simple chain, the idea is the chain rule:
This equation says that a weight affects the loss through the later values it helps create. The real network has many layers and many weights, but the principle is the same. PyTorch performs this derivative calculation automatically. Then the Adam optimizer updates the weights in small steps. The learning rate in the training script is , so the updates are careful rather than sudden.
Concept in Focus: The checkpoint does not store the finished painting. It stores the trained color rule, normalization values, image size, music frame rate, Fourier frequencies, zoom levels, and zoom target information needed to rebuild the system later.
This section gives the central neural representation: an image is treated as a learned function from location and music to color. Chapter 5 explains how that color function becomes visible as strokes on a canvas.
Program
The source tutorials linked above introduce simpler versions of these ideas. This chapter follows the extended Inner Landscapes implementation, with the training settings and features described here.
Training is defined in neural_network_music.py. These fragments connect the ideas above to the implementation.
The code blocks are selected excerpts, not separate runnable programs. The source files contain the surrounding imports, data preparation, and setup. The file map in Chapter 5 identifies the complete implementation shared by both chapters.
Training the Neural Color Model
Training happens in neural_network_music.py. This file contains the audio-feature functions, the zoom-level functions, the neural network class, the training loop, and the checkpoint-saving step.
The training jobs are stored in a dictionary. Each job gives the program the main files and settings needed for one emotion:
TRAINING_JOBS = {
    "joy": {
        "image": "joy.png",
        "audio": "Joy.wav",
        "ckpt": "ckpts/joy_ckpt.pt",
        "zoom_crop_sizes": EMOTION_ZOOM_CROP_SIZES["joy"],
    },
}
The full dictionary includes the five emotions used by the project. The important idea is that the same training function can be reused. The program changes the image, audio, checkpoint path, and settings for each emotion, but the basic training procedure stays the same.
At the bottom of the file, the script loops over the training jobs:
for emotion_name, cfg in TRAINING_JOBS.items():
    train_emotion_model(
        emotion_name=emotion_name,
        image_file=cfg["image"],
        audio_file=cfg["audio"],
        ckpt_path=cfg["ckpt"],
        emotion_zoom_crop_sizes=cfg["zoom_crop_sizes"],
        emotion_fourier_frequencies=cfg.get("fourier_frequencies"),
    )
This loop is the start of the training pipeline. For each emotion, it calls train_emotion_model. That function prepares the image, prepares the music, trains the model, and saves the checkpoint.
Building Training Examples
Inside train_emotion_model, the first major task is to turn the image and audio into training examples. The image is resized to the training grid:
H, W = 512, 512
target_img = Image.open(image_file).convert("RGB").resize((W, H))
The program also creates one coordinate for every pixel location. These coordinates are normalized from to , matching the coordinate system explained in the Methodology section.
Next, the audio becomes music features:
raw_spec = make_mel_spec(audio_file, latent_size, target_fps)
spectrogram, spec_min, spec_max = normalize_spec(raw_spec)
The first line builds the -bin Mel spectrogram. The second line applies the log transform and normalization. The values spec_min and spec_max are saved because the notebook must normalize later audio clips in the same way.
The program also computes zoom levels from a separate -bin Mel spectrogram:
raw_zoom_spec = make_mel_spec(audio_file, p75_zoom_mels, target_fps)
p75_signal, zoom_levels, edges, percentiles = compute_p75_zoom_levels(
    raw_zoom_spec, emotion_name, target_fps
)
The result zoom_levels tells the training code which zoom target should be used at each music frame. A frame with a lower zoom level uses a wider target image. A frame with a higher zoom level uses a closer target image.
When the model trains on one music frame, the same music vector is repeated for every image location:
music_vec = spec_frame.unsqueeze(0).repeat(H * W, 1)
inp_train = torch.cat([coords, music_vec], dim=1)
This creates the input table described earlier. Each row contains one image location and the current music features. The network can then predict one RGB color for each row.
Training Loop and Loss
The neural network itself is defined by the class XYSpecNet. Its input is the pair of ideas we have been using throughout the chapter: image location and current music features. Its output is a predicted RGB color.
During training, the program repeatedly chooses a sampled music frame, builds the model input, predicts colors, computes the loss, and updates the weights:
pred = model(inp_train)
l1 = torch.abs(pred - target_music_tensor)
l2 = (pred - target_music_tensor) ** 2
loss = ((0.5 * l1 + 0.5 * l2) * pixel_weights).mean()

loss.backward()
optimizer.step()
These lines are the code version of the loss and backpropagation discussion. The prediction pred is compared with target_music_tensor, which contains the target RGB colors from the selected zoom image. The L1 and L2 terms measure color error. The pixel_weights term gives extra importance to image locations with stronger edge structure.
The line loss.backward() asks PyTorch to compute the derivatives. The line optimizer.step() uses those derivatives to update the weights. In this project, the optimizer is Adam with learning rate .
Practical Takeaway: The training script does not paint the final video. It teaches a neural network to answer one question well: given an image location and current music features, what color should be predicted?
Saving the Checkpoint
After training, the script saves a checkpoint. A checkpoint is the handoff from training to rendering. It stores the trained model weights and the settings needed to rebuild the same model later.
A shortened version of the checkpoint code looks like this:
torch.save(
    {
        "model_state_dict": model.state_dict(),
        "spec_min": spec_min,
        "spec_max": spec_max,
        "zoom_levels": zoom_levels,
        "zoom_crop_sizes": emotion_zoom_crop_sizes,
    },
    ckpt_path,
)
The real checkpoint stores more fields, including image size, music frame rate, hidden-layer size, Fourier frequencies, loss history, and paths to visual checks. The most important field is model_state_dict. It contains the learned weights and biases of the neural network.
The checkpoint is why the rendering notebook does not have to train again. It can rebuild the model, load the saved weights, and continue from the trained color rule.
Inspecting the Learned Image
Training saves image previews and a loss curve. Querying the model across a coordinate grid lets us inspect its color predictions before adding the stroke texture of Chapter 5.
with torch.no_grad():
    final_spec_frame = train_specs[0]
    final_input = make_model_input(coords, final_spec_frame, H, W)
    trained_img = model(final_input).reshape(H, W, 3).numpy()
The model can also be queried at normalized locations on a larger canvas. Changing the rendering grid does not itself require training a different model.
Exercises
These questions use the definitions and settings developed in this chapter.
Sound and Music Features
-
In one or two sentences, explain why the program converts sound into a Mel spectrogram instead of using the raw audio wave directly.
-
The project uses a target rate of music frames per second. If an audio file has sample rate , calculate the hop length.
-
If one music frame has Mel values, what is the shape of a spectrogram with music frames?
-
Explain the difference between the -bin Mel spectrogram and the -bin Mel spectrogram in this project.
-
Why does the program use a log transform and normalization before giving music features to the neural network?
-
In your own words, explain why a single music frame must be paired with image locations before it can be used for color prediction.
Neural Network and Training
-
During training, the image grid has size . How many image locations are in one full grid?
-
One model input row contains and music values. How many input values are in that row before Fourier coordinate encoding?
-
Explain what a weight and a bias do inside a neuron.
-
Why does the network use activation functions between linear layers?
-
Write the meaning of the expression in words.
-
Suppose a predicted color channel is and the target color channel is . Compute the L1 error, the L2 error, and the combined error for that one channel.
-
Why does the training loss use both L1 and L2 error instead of only one of them?
-
Explain why edge-weighted training gives extra attention to visually important parts of the reference image.
-
What is backpropagation used for during training?
-
Name three kinds of information saved in the checkpoint.
Visual Scale
-
What does a smaller zoom crop size mean visually?
-
Why does the program select percentile thresholds separately for each emotion?
-
Why are minimum hold time and hysteresis useful?
-
With 22 encoded coordinate features and 64 music features, how many features reach the first linear layer?
Summary
The network learns a rule from location and current music features to RGB. The 64-bin spectrogram provides color-model inputs, while the 96-bin representation selects visual scale. Fourier features support spatial detail, and edge-weighted L1 and L2 error guides training. A checkpoint preserves the learned rule and the settings required to restore it.
In Chapter 5, walkers query that rule at their current positions and turn predicted colors into accumulating strokes. Chapter 11 considers the artistic choices made through the combined system.
Footnotes
-
Kayo Yin et al., “NeuroMV: A Neural Music Visualizer”, 2022. ↩